Category Archives: Performance

The result of implementing a change which lowered the quantity but increased the quality of sign-ups.

Achieving More with Less

Setbacks: 2025 has been a challenging year for the Open Library community and the library world. We began the year by upgrading our systems in response to cybersecurity incidents and fortifying our web services to withstand relentless DDOS (distributed denial of service) attacks from bots. We developed revised plans to achieve More with Less to meet the needs of patrons who lost access to 500,000 books due to late-2024 takedowns. The year continued to bring setbacks, including a Brussels Court order, which resulted in additional removals, and contesting thousands of spammy automated takedown requests from an AI company. Just last month, we responded to a power outage affecting one of our data centers and then a cut that was identified in one of our internet service provider’s fiberoptic cables, resulting in reduced access.

Given all these setbacks, why weren’t we seeing a decline in sign-ups?

Less is More: Putting patrons’ experience first. As the year progressed and we reviewed our quarterly numbers, one metric that circumstantially held high was sign-ups. The Open Library is historically a significant source of registrations for the Internet Archive, contributing to approximately 30% of all registrations. Some websites may have found it reassuring that, despite all the challenges presented in 2024 and 2025, adoption seemed to keep its pace. At the Open Library, we measure success in value delivered to readers — not registrations — and this trend seemed to indicated something may have become out of balance:

What reason(s) might explain why registrations remain steady when significant sources of value are no longer accessible?

We hypothesized some class of patrons are signing up with an expectation and then not getting the value they are expecting.

Testing the hypothesis: The first step of our investigation was to take inventory of the possible reasons one might register an account. Each of the following actions require accounts:

  • Borrowing a book
  • Using the Reading Log
  • Adding books to Lists
  • Community review tags
  • Following other readers
  • Reading Goals

Supporting Evidence: We started by reviewing the Reading Log because it’s the platform’s largest source of engagement, with 5M unique patrons logging 11.5M books. We discovered that millions of patrons had only logged a single book. There’s nothing inherently bad about this statistic, in fact many websites may be happy about this engagement. However, unlike many book catalog websites, the Open Library is unique in that it links to millions of books that may be accessed through trusted book providers. It is thus reasonable that many patrons come to the Open Library website with the intent of accessing a specific title. This data amplified occasional reports from patrons who expressed disappointed when clicking “Want to Read” did not result in access to the book.

Refined hypothesis: Based on these learnings, we felt confident the “Want to Read” button may be confusing new patrons who thought clicking the button would get them access to the book. Under this lens, each of these registrations represents adoption for the wrong reason: i.e. a patron is compelled by the offering to register, but they bounce because what they get is a broken promise.

Trying a solution: Data gave us confidence the “Want to Read” button may be confusing new visitors to the site, but it also revealed that hundreds of thousands of patrons are actively using the Reading Log to keep track of books and we didn’t want to confuse the experience for them. We decided to change the website so that non-logged-in patrons, would see the “Want to Read” button as “Add to List” instead, whereas logged-in returning visitors would continue to see the “Want to Read” button they were used to.

The original button presented to patrons, which shows a potentially misleading: "Want to Read"
Before: The original button presented to patrons, which shows a potentially misleading: “Want to Read”
The button presented to logged out patrons after the change, reading "Add to List" instead of "Want to Read"
After: The button presented to logged out patrons after the change, reading “Add to List” instead of “Want to Read”

Results: When our team launched this week’s deploy, we noticed a few performance hiccups: our latest deploy increased memory demands and our servers began using too much memory, causing swapping. After some fire-fighting, we were able to make adjustments to our workers that normalized performance, though we remained alert.

A chart from Open Library's grafana system indicating that the website was facing a large number of 503's (i.e. it failed to respond to patron requests)

Later that night, we noticed a significant drop in registrations and started frantically testing the website:

A chart from Open Library's grafana system indicating that registrations-per-minute had fallen in the latest deploy.

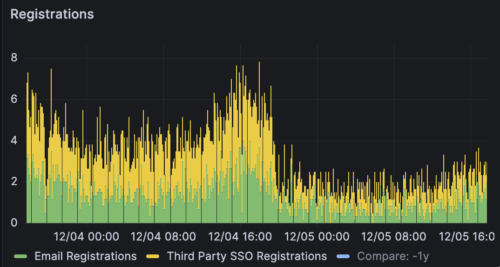
We were thrilled to realize that our services are working correctly and the chart accurately reflected — what we hope to be — a decrease in bad experiences for our patrons.

Conclusion: Sometimes, less is more. We anticipate this will be the first small change in a long series of marginal improvements we hope to bring us closer into alignment with the core needs of our patrons. As we move towards 2026, we will continue to respond to the new normal shaped by recent events with the mantra: back to basics.

Open Library Search: Balancing High-Impact with High-Demand

The Open Library is a card catalog of every book published spanning more than 50 million edition records. Fetching all of these records all at once is computationally expensive, so we use Apache Solr to power our search engine. This system is primarily maintained by Drini Cami and has enjoyed support from myself, Scott Barnes, Ben Deitch, and Jim Champ.

Our search engine is responsible for rapidly generating results when patrons use the autocomplete search box, when apps make book data requests using our programatic Search API, to load data for rending book carousels, and much more.

A key challenge of maintaining such a search engine is keeping its schema manageable so it is both compact and efficient yet also versatile enough to serve the diverse needs of millions of registered patrons. Small decisions, like whether a certain field should be made sortable can — at scale — make or break the system’s ability to keep up with requests.

This year, the Open Library team was committed to releasing several ambitious search improvements, during a time when the search engine was already struggling to meet the existing load:

  • Edition-powered Carousels that go beyond the general work to show you the most relevant, specific, available edition, in your desired language.
  • Trending algorithms that showcase what books are having sudden upticks, as opposed to what is consistently popular over stretches of time.
  • 10K Reading Levels to make the K-12 Student Library more relevant and useful.

Rather than tout a success story (we’re still in the thick of figuring out performance day-by-day), our goal is to pay it forward, document our journey, and give others reference points and ideas for how to maintain, tune, and advance a large production search system with a small team. The vibe is “keep your head above water.”

An AI generated image of someone holding a book above water

Starting in the Red

Towards the third quarter of last year, the Internet Archive and the Open Library were victim to a large scale, coordinate DDOS attack. The result was significant excess load to our search engine and material changes in how we secured and accessed our networks. During this time, the entire Solr re-indexing process (i.e. the technical process for rebuilding a fresh search engine from the latest data dumps) was left in an broken state.

In this pressurized state, our first action was to tune Solr’s heap. We had allocated 10GB of RAM to the Solr instance but also the heap was allowed to use 10GB, resulting in memory exhaustion. When Scott lowered the heap to 8GB, we encountered fewer heap errors. This was compounded by the fact that previously, we dealt with long spikes of 503s by restarting Solr, causing a thundering herd problem where the server would restart just to be overwhelmed by heap errors.

With 8GB of heap, our memory utilization gradually rose until we were using about 95% of memory and without further tuning and monitoring, we had few options other than to increase RAM available to the host. Fortunately, we were able to grow from ~16GB to ~24GB. We typically operate within 10GB and are fairly CPU bound with a load average of around 8 across 8 CPUs.

We then fixed our Solr re-indexing flow, enabling us to more regularly “defragment” — i.e. run optimize on Solr. In rare cases, we’ve been able to split traffic between our prod-solr and staged-solr to withstand large spikes in traffic though typically we’re operating from a single Solr instance.

Even with more memory, there’s only so many long, expensive requests Solr can queue before getting overwhelmed. Outside of looking at the raw Solr logs, our visibility into what was happening across Solr was still limited, so we put our heads together to discuss obvious cases where the website makes expensive calls wastefully. Jim Champ helped us implement book carousels that load asynchronously and only when scrolled into view. He also switched the search page to asynchronously load the search facets sidebar. This was especially helpful as previously, trying to render expensive search facets would cause the entire search results page, as opposed to only the facets side menu, to fail.

Sentry on the Hill

After several tiers of low hanging fruit was plucked, we used more specific tools and added monitoring. First, we added sentry profiling which gave us much more clarity about which queries were expensive, and how often Solr errors were occurring.

Sentry allows us to see a panoramic view of our search performance.

Sentry also gives us the ability to drill in and explore specific errors and their frequencies.

With profiling, we can even explore individual function calls to learn where the process is spending the most amount of time.

Docker Monitoring & Grafana

To further increase our visibility, Drini developed a new type of monitoring docker container that can be deployed agnostically to each of our VMs and use environment variables so that only relevant jobs would be run for that host. This approach has allowed us to centrally configure recipes so each host collects the data it needs and uploads it to our central dashboards in Grafana.

Recently, we added labels to all of our Solr calls so we can view exactly how many requests are being made of each query type and what their performance characteristics are.

At a top level, we can see in blue how much total traffic we’re getting to Solr and the green colors (darker is better) lets us know how many requests are being served quickly.

We can then drill in and explore each Solr query by type, identifying which endpoints are causing the greatest strain and giving us a way to then analyze nginx web traffic further in case it is the result of a DDOS.

Until recently, we were able to see how hard each of our main Open Library web application works were working at any given time. Spikes of pink or purple were when Open Library was waiting for requests to finish from Archive.org. Yellow patches — until recently — were classified as “other,” meaning we didn’t know exactly what was going on (even though Sentry profiling and flame graphs gave us strong clues that Solr was the culprit). By using pyspy with our new docker monitoring setup, we were able to add Solr profling into our worker graphs on Grafana and visualize the complete story clearly:

Once we turned on this new monitoring flow, it was clear these large sections of yellow, where workers were inundated with “unknown” work, were almost entirely (~50%) Solr.

With Great Knowledge…

Each graph helped us further direct and focus our efforts. Once we knew Open Library was being slowed down primarily by Solr, we began investigating requests and Drini noticed many Solr requests were living on for more than 10 seconds, even though the Open Library app has been given instructions to abandon any Solr query that takes more than 10 seconds. It turns out, even in these cases, Solr may continue to process the query in the background (so it can finish and cache the result for the future). This “feature” was resulting in Solr’s free connections becoming exhausted and a long haproxy queue. Drini modified our Solr queries to include a timeAllowed parameter to match Open Library’s contract to quit after 10 seconds and almost immediately the service showed signs of recovery:

After we set the timeAllowed parameter, we began to encounter more clear examples of queries failing and investigated patterns within Sentry. We realized a prominent trends of very expensive, unuseful, one-character or stop-word-like queries like “*" or “a" or “the". By looking at the full request and url parameters in our nginx logs, we discovered that the autocomplete search bar was likely responsible for submitting lots of unuseful requests as patrons typed out the beginning of their search.

To fix this, we patched our autocomplete to require at least 3 characters (and not e.g. the word “the”) and also are building in backend directives to Solr to pre-validate queries to avoid processing these cases.

Conclusion

Sometimes, you just need more RAM. Sometimes, it’s really important to understand how complex systems work and how heap space needs to be tuned. More than anything, having visibility and monitoring tools have bee critical to learning which opportunities to pursue in order to use our time effectively. Always, having talented, dedicated engineers like Drini Cami, and the support of Scott Barnes, Jim Champ, and many other contributors, is the reason Open Library is able to keep running day after day. I’m proud to work with all of you and grateful for all the search features and performance improvements we’ve been able to deliver to Open Library’s patrons in 2025.